Tools used
| Figma | |
| HTML | |
| CSS | |
| JavaScript | |
| Google Sheets API |
This post is also available in Русский
Landing Page development for a sports analytics project, including Google Sheets integration and unique visual style.
📌 Description of the work done
Within the framework of the project implementation, an adaptive web site was created, emphasizing the team’s professionalism, transparency and customer focus. Main stages of work:
-
Design and structure:
- A unique visual style corresponding to the project logo was developed.
- Figma layouts were prepared, taking into account adaptation for desktop and mobile devices.
- Orange color was used as the main accent, harmonizing with the corporate palette.
-
Functional integration:
- Integration with Google Sheets has been set up to automatically update the statistics block, which displays the latest bets with details.
-
Content and interaction:
- Added “Go to Project” and “Statistics” buttons providing navigation to the Telegram channel and statistics page.
- Created FAQ section with drop-down answers to popular questions.
- Created “About Us” block with text emphasizing the uniqueness of the approach and professionalism of the team.
-
Elements of interaction:
- The project logo and the slogan “Analytics from the pros” were added to the header.
- A banner for the affiliate program with a place for a promo code was prepared.
-
Footer:
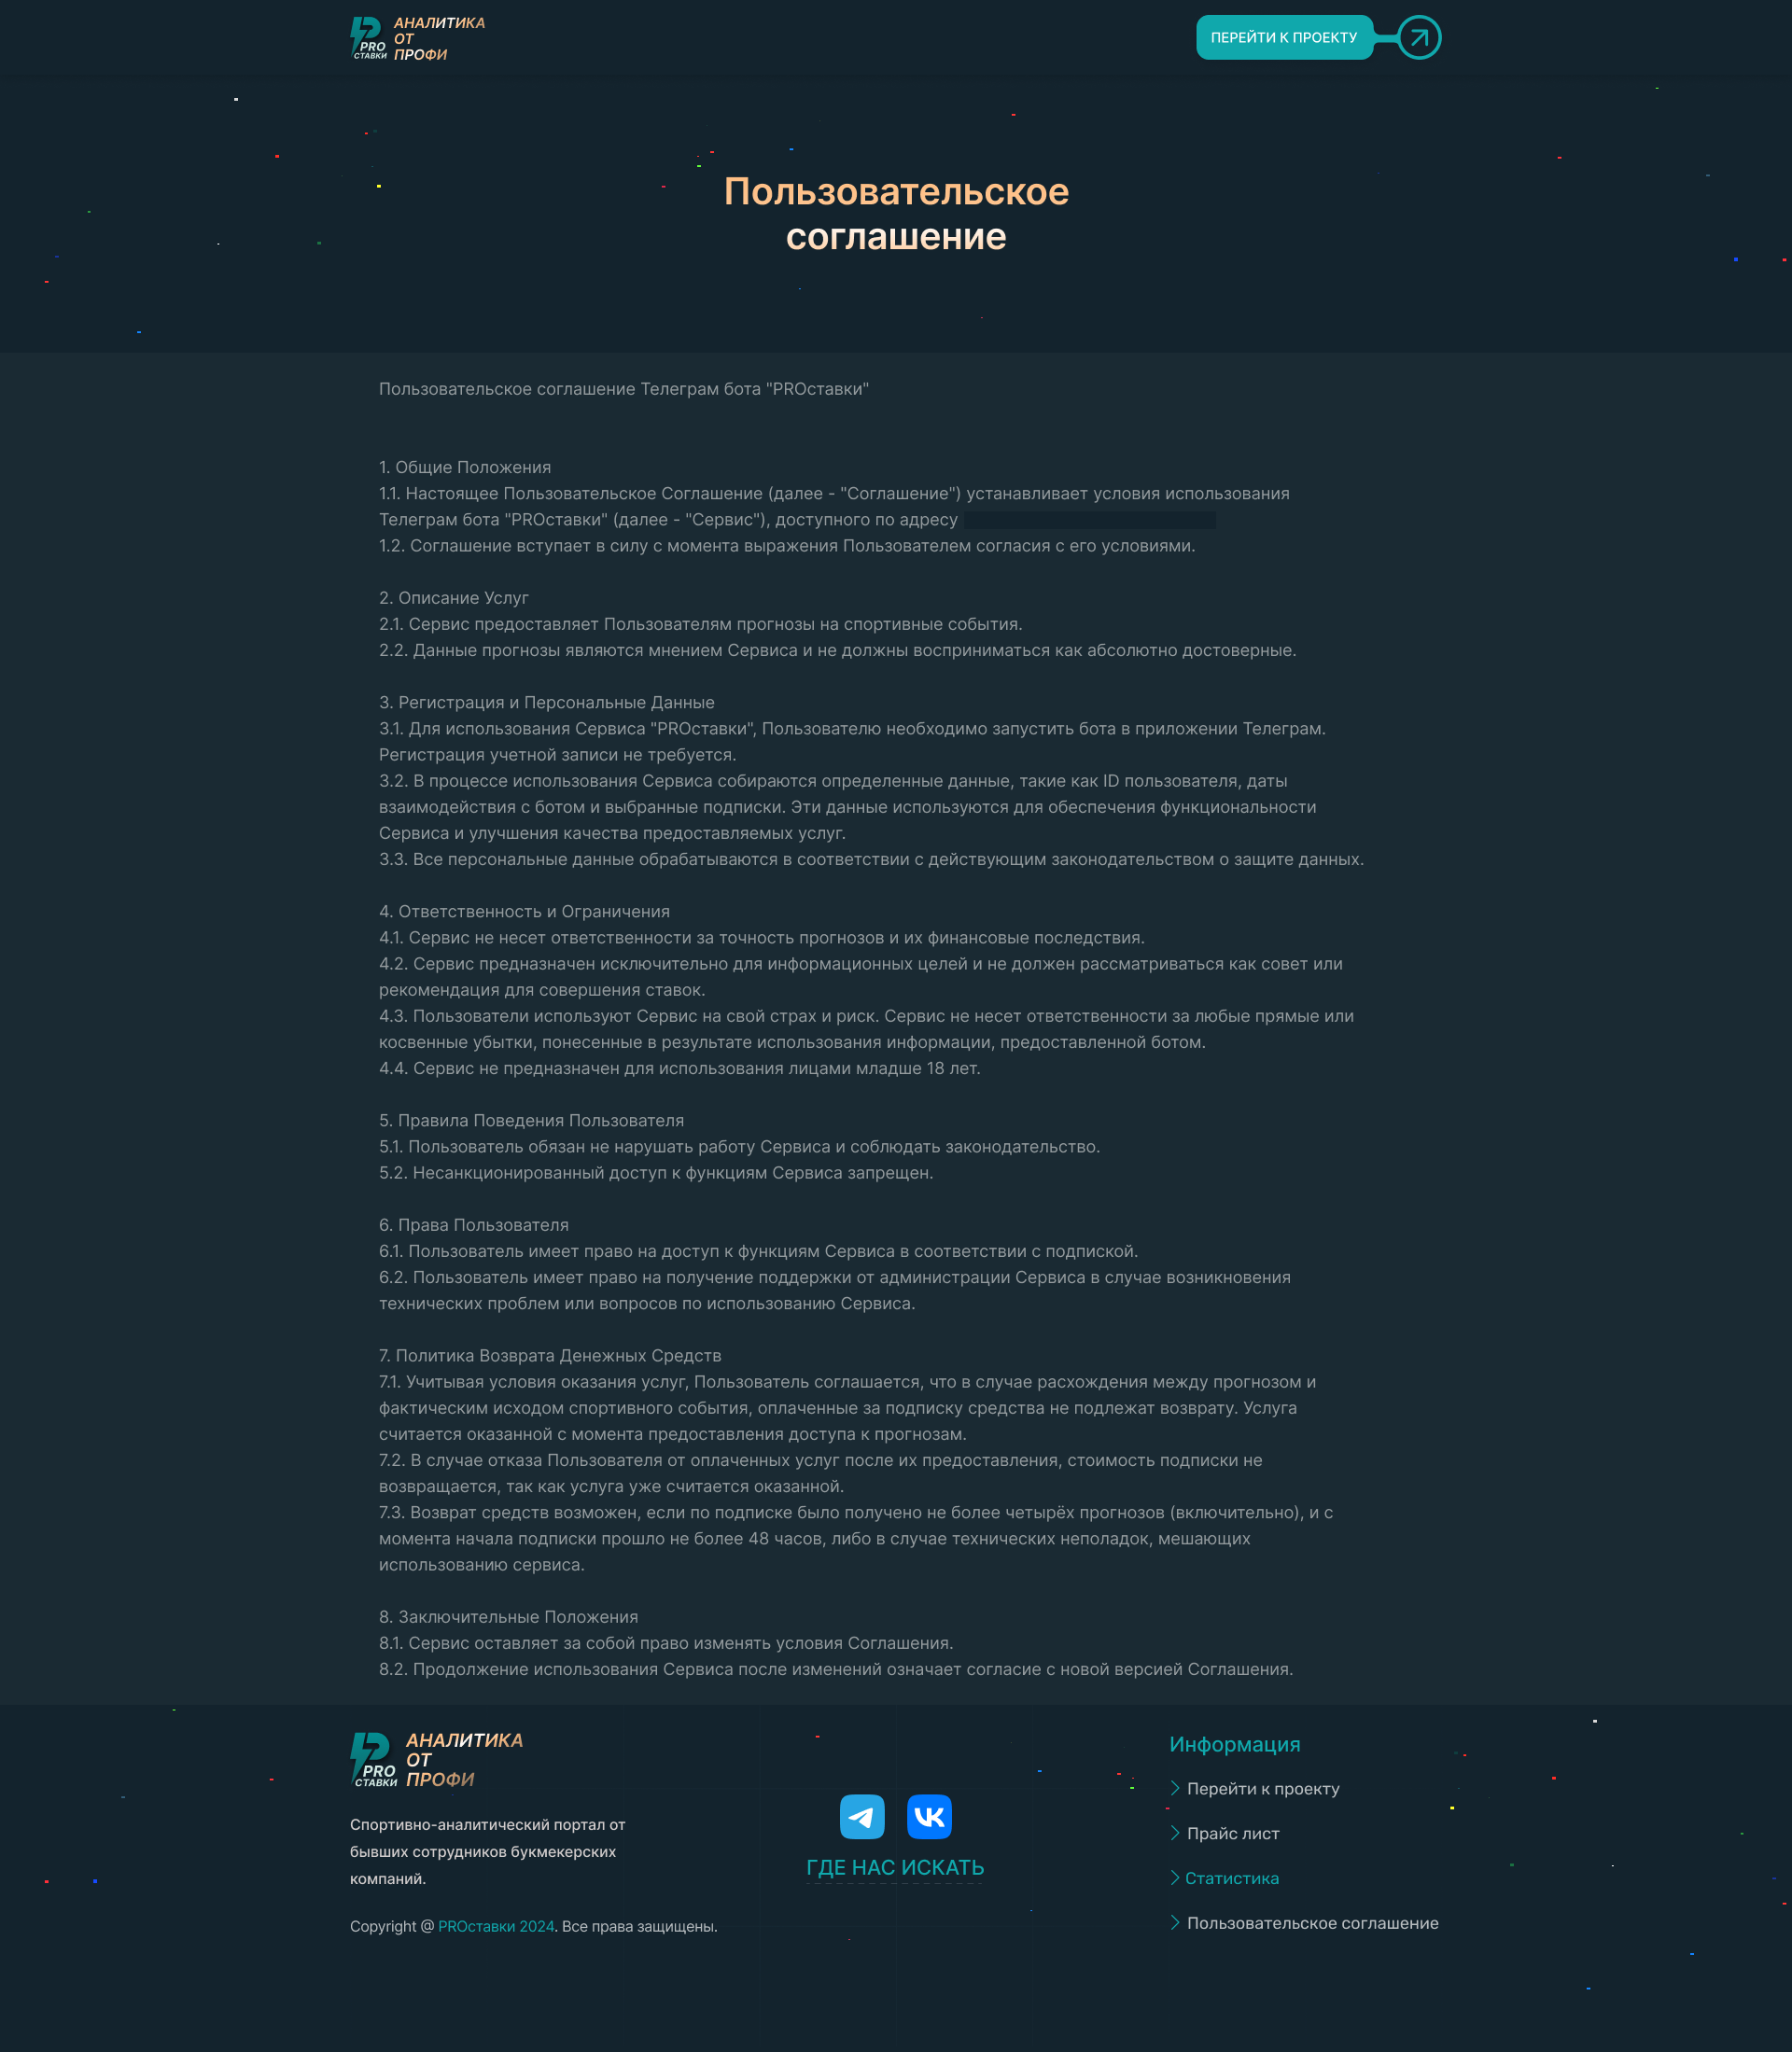
- Developed footer with links to the main sections (project, price list, statistics and user agreement).
- Added social media icons with hyperlinks to Telegram and VKontakte.
Key Stages of Development:
- ✔️ Development of corporate identity with orange accent color
- ✔️ Integration with Google Sheets for automatic download of statistics
- ✔️ Creation of interactive blocks (FAQ, reviews, etc.)
- ✔️ Adaptation for mobile devices
Result of work
🚀 Demo of the desktop version
This video demonstrates the entire live functionality of the landing page, including updating bid statistics via Google Sheets and visualizing statuses.
📱 Adaptive design
Desktop version


Mobile version
🔧 Creation process
-
Research and planning:
- Reference analysis and definition of key requirements.
- Creation of page structure and content.
-
Design:
- Development of layouts in Figma.
- Making edits and approving the design.
-
Development:
- HTML/CSS layout.
- JavaScript integration for interactive elements.
- Customization of integration with Google Sheets.
-
Testing and finalization:
- Testing for cross-browser compatibility.
- Testing on different devices.
- Bug fixes and performance optimization.
🎨 Color palette and fonts
Color palette
| Name | Code | Example |
|---|---|---|
| Basic color | #10A8AC | |
| Background | #13232D | |
| Text | #D2E9E3 | |
| Accent color | #10A8AC/#FEC087 |
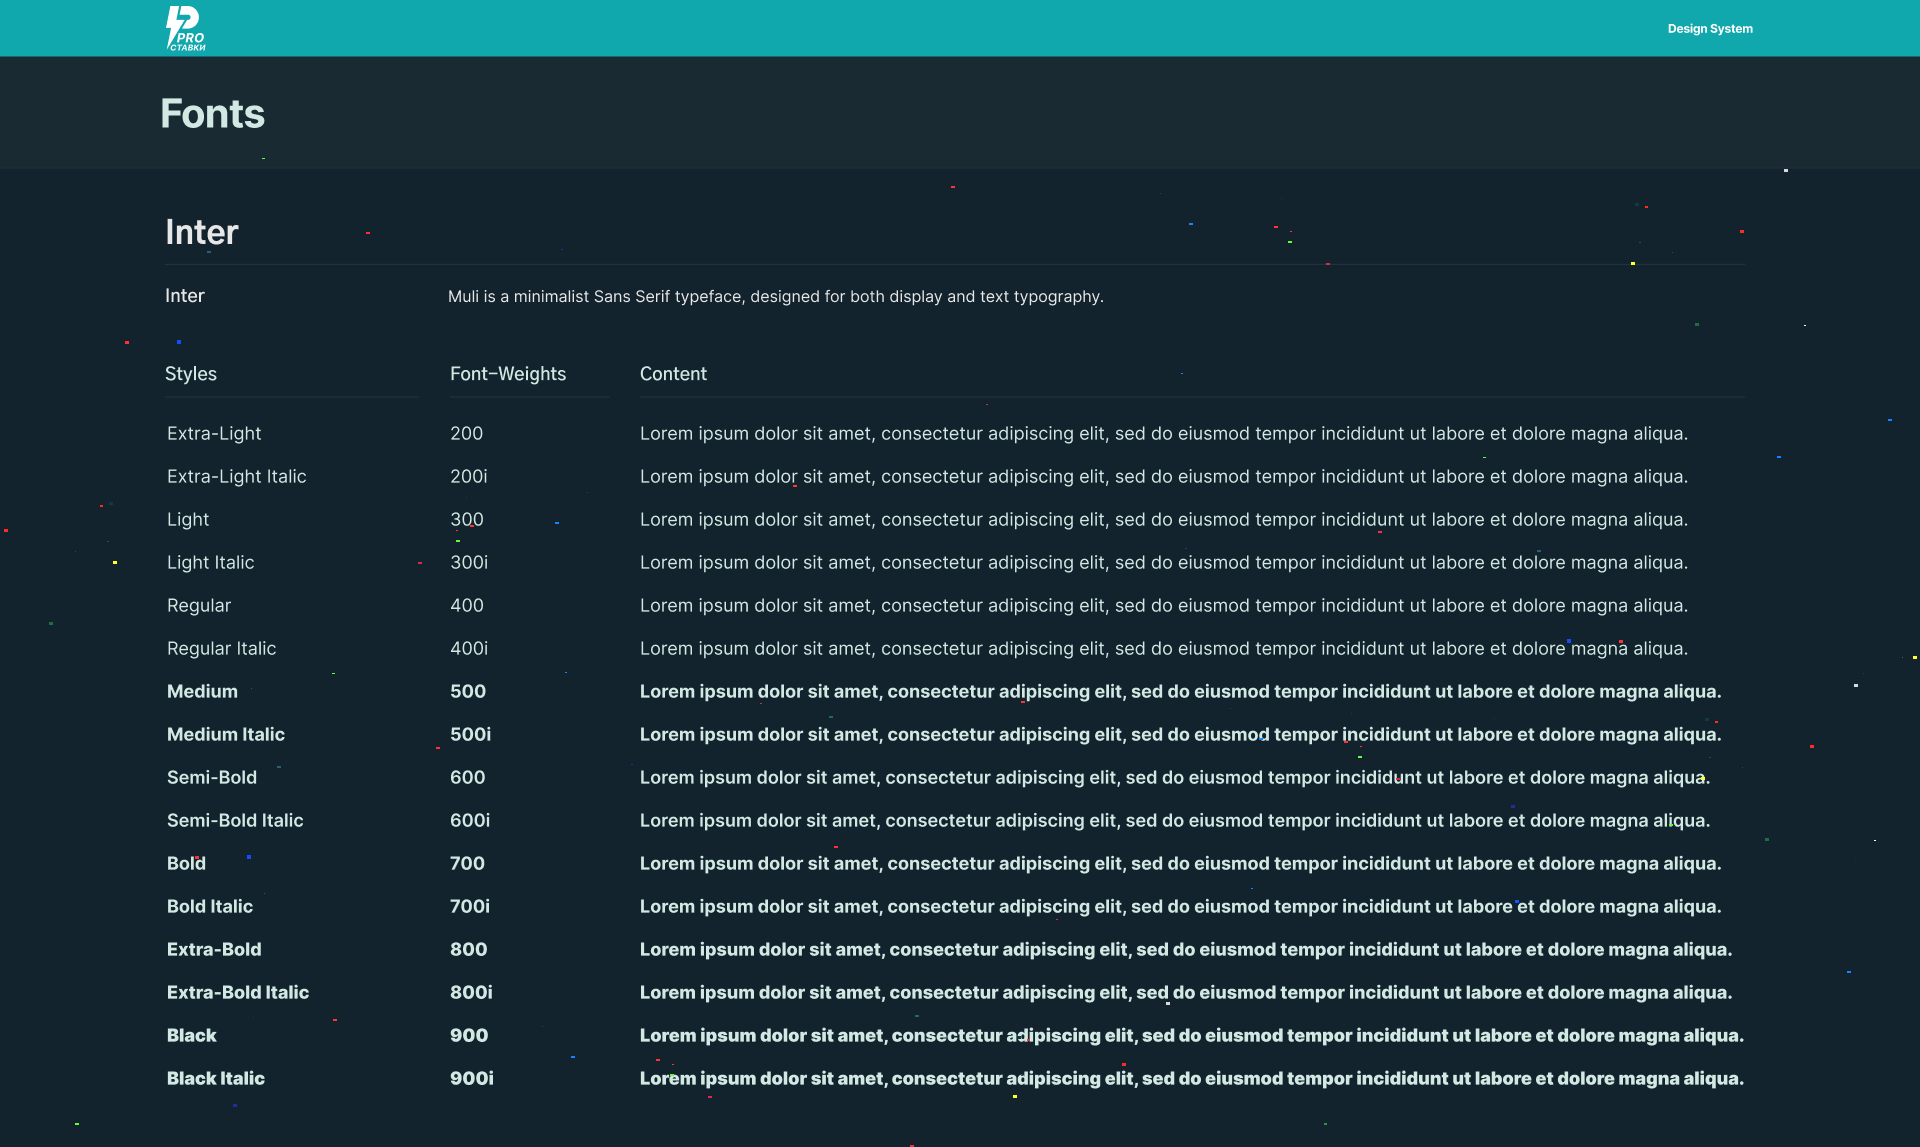
Fonts

- Titles: Inter Bold
- Basic text: Inter Regular
- Accents: Inter Medium
🌐 Final results
- Fully adaptive and functional landing page.
- Integration with Google Sheets for dynamic display of statistics.
- Interactive elements.


